
This article provides a basis for using gated time domain and a highly reflective mirror to measure the gain, phase, beamwidth and radiation pattern of broadband antennas. The tests were completed using the Anritsu VectorStar VNA. The speed and data points (100,000) make possible high resolution in time domain. Three commercial reference horns were measured and an aperture and mirror conductivity correction applied. The resulting data agreed reasonably well with the published data. Two additional classical methods were also performed for validation.
Antenna measurement involves the determination of received power over a distance with a known source power. The simple implementation of the Friis equation reduces to three variables, the GTx, GRx and path levels.
 (1)
(1)
The classical methodology for solving for GRx involves substitution into the link of a known reference or the knowledge of the path and GTx , the two antenna method where two identically constructed antennas reduce the problem to path knowledge, and finally the 3 equation 3 unknown approach where all three variables are solved through all possible combinations of three antennas. With the practical advent of time domain, the two antenna method is extended with the use of a mirror image of itself creating a perfect clone. By performing an Az over EL spherical scan, beam width contours can be measured. The aperture of the mirror can be determined. The integration of the received power over the mirror aperture and the total efficiency form a correction factor, making it unnecessary to have a large mirror. This enables measurements at variable distances. The two and three antenna method and calibration lab data are the data validation basis.
Time Domain Test and Measurement – Reflection
While most Purcell mirror methods used metallic sheets, they exhibit conductive losses which can affect the results. An aluminum coated 0.36M2 plastic mirror 0.2”(5MM) thick was used for this measurement (Figure 1).
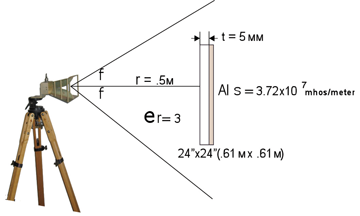
Figure 1: Test configuration for the measurement of the antenna and its mirror image
The plastic body of the mirror can be made to benefit measurements based on its thickness. The thickness of the mirror and the refractive index combine to make the body exhibit antireflection at quarter wave frequencies.
In this case, the reflection at the mirror is:
 (2)
(2)
The reflection of the mirror surface is significant. The ¼ wave thickness occurs at 4.1GHz. As with classical quarter wave coatings, 100% reflection will occur when the penetrating wave reflects back and combines with the reflected wave. The affect is easily seen using a 217 ohm two port transmission line with 377 ohm port impedances (Figure 2).
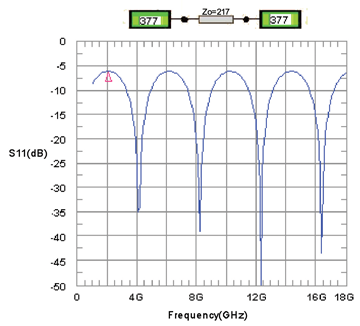
Figure 2: Mirror dielectric reflection simulated with the DE Antenna Measurement & Network Simulator
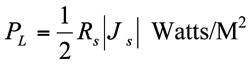
At 4 GHz, the aluminum mirror coating reflection power ρM = −1 will combine with the acrylic reflection, and total reflection occurs. Everywhere else, the mirror is little improved. The mirror finite conductivity will reduce the amount of reflected power. The Poynting vector power loss is:
 (3)
(3)
It can be shown that for good conductors, the induced current density along the conductor surface is given by
![]() (4)
(4)
The conductor conductivity σ and skin depth δ yield an impedance given by:
 (5)
(5)
Substituting (3) and (4) into (2) yields the classical surface power loss:
 (6)
(6)
The surface resistivity calculated from the planar skin depth yields a correction to the reflection for the single antenna measurement.
The loss is not significant; however, because the mirror area increases as the square of the size, loss can be high. A 2-meter square mirror with silver backing would have nearly 1.5dB loss at 18GHz (Figure 3).

Figure 3: Mirror conductivity loss for a 0.61M2 mirror with silver, copper, aluminum and gold backing
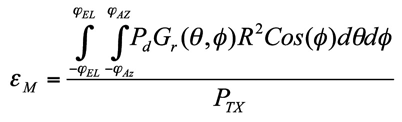
As depicted in Figure 1, the mirror aperture cannot be large enough to receive the entire pattern. If the aperture efficiency is defined as:
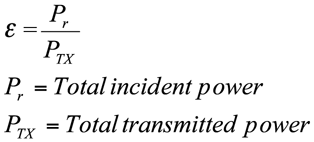 (7)
(7)
then integration across the mirror face and a spherical Az/EL scan can be used to correct the results.
 (8)
(8)
 (9)
(9)
 (10)
(10)
 (11)
(11)
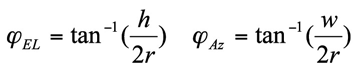
Where h is the mirror height, w is the mirror width and κ is the correction factor. It is necessary for the mirror shape to match the Az/EL scan type. Az over EL and EL over Az require a rectangular mirror.
Measurement Results
A standard 1-18GHz horn and Anritsu Vectorstar VNA were used in time domain. The Diamond Engineering Antenna Test System provided the Az/EL rotation, data collection and data processing (Figure 4). The horn calibration data extended from 1 to 18GHz. The VNA was calibrated from 0.7 to 20GHz with 801 data points. The time domain mode was band pass, nonharmonic sweep. This is the simplest mode possible. The loss of the DC level means that phase cannot be accurately measured. These measurements were only concerned with amplitude.
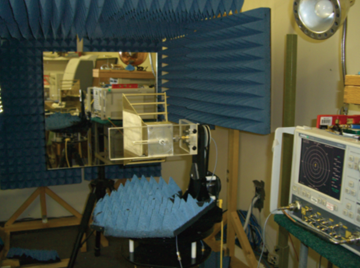
Figure 4: Horn mirror measurement test setup
A harmonic sweep, high resolution and bandwidth (10,000 points) were performed for mismatch identification inside the horn.
The time domain resolution in terms of distance is approximated by:
 (12)
(12)
This results in about 3.1cm resolution.
The second consideration is Aliasing. Unlike real time domain, the Ifft-based method is build on cyclic properties. The response repeats itself depending on the frequency step size.
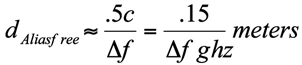 (13)
(13)
This results in about a 7 meter range.
The ungated time domain response shows the discontinuities of the horn and the mirror (Figure 5).

Figure 5: Time domain response showing the horn mismatch, horn aperture, mirror and reflection
The time profile shows the extent of the horn length is 21cm. The gate was then set to the center with a span of 10.5cm (Figure 6). This assumes the mismatch between the horn-air-aperture is identical to the probe mismatch. For a good match, this is a small error and can be considered the center.
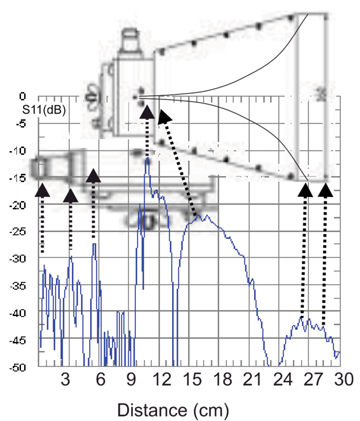
Figure 6: High resolution harmonic sweep shows the location and magnitude of discontinuities inside the test antenna (Vivaldi arrow is tilted due to cavity extent)
Next, the gated signal is transformed back to the frequency domain yielding the original horn, the path, the horn image and the losses (Figure 7). Since the equivalent time pulse traverses the entire network twice, each attenuation component is doubled with the exception of the losses since they have no time extent. The corrections were calculated using the Diamond Engineering icon-based Antenna Network & Measurement simulator.

Figure 7: Time gate applied to the time domain negates the discontinuities up to the mirror
The measurement-enabled schematic represents a single path removal, the measurement, a single horn (sqrt(S)) and the mirror correction icon (Figure 8). The resulting gain of the test horn is the total gain Gφ + Gθ. It is not possible to separate the gain components with this method. Figure 9 shows the resulting gain with and without the aperture and conductivity correction and the manufactures published data.
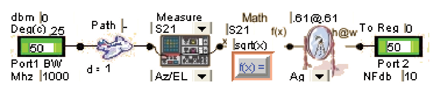
Figure 8: A measurement-enabled schematic

Figure 9: Gain of the test horn with and without correction and the calibration lab data
There is good agreement up to 15GHz. The manufactures data differs from the reflection method data by 1.8dB. It can be seen the steep slope is the cause of the larger delta. The negative slope indicates the beam is breaking up (Figures 10, 11 and 12).
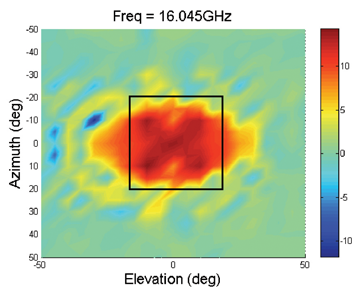
Figure 10: Beam distortion with the mirror overlay occurring at 16GHz.

Figure 11: Showing the breakup of the beam, -3,-6 and -10dB beamwidth contours with the mirror overlay showing areas of correction at 16GHz
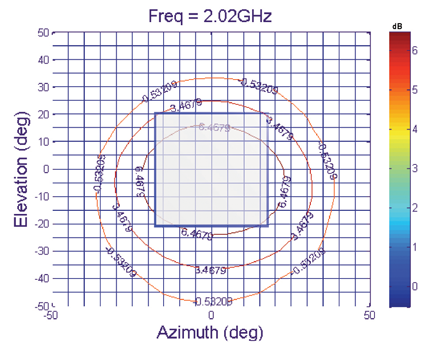
Figure 12: -3,-6 & -10dB Normal beamwidth contours with the mirror overlay showing areas of correction at 2GHz
The mirror method has the ability to measure the AUT phase. For accurate phase measurement, the gating must be correctly set. The mirror produces the horn image at twice the distance. The VNA in S11 time domain divides the time/distance by 2. The gated frequency data phase includes the two-way path, as seen in the group delay for the gated data (Figure 13).

Figure 13: Gated frequency group delay showing the entire two-way path from a mirror located at 1.15 meters
The group delay indicates the phase slope is correct even in band pass mode.
Two- and Three-Antenna Methods
The two-antenna method is based on identical antennas. The network reduces to Figure 14.
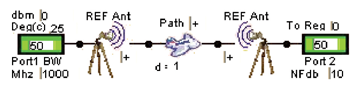
Figure 14: Two identical antennas enable the entire link to be reduced to one unknown 
Similar reference horns were positioned 1 meter and boresite aligned (Figure 15). The Anritsu Vectorstar was auto calibrated using a bandwith of 100Hz and 801 data points. Figure 16 shows excellent agreement with the calibration data.
The three-point method was also performed using the two identical horns and a similar horn from another manufacture. The three-point method involved the solution to the Friis equation by establishing a 3×3 matrix.
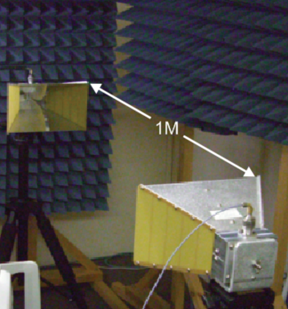
Figure 15: Two-antenna test setup

Figure 16: Two-antenna method gain and calibration lab gain
![]() (15)
(15)
or
![]() (16)
(16)
The matrix is created by measuring the link with every possible combination of the three antennas. While the three antenna method implies an exact solution, it is subject to ones ability to interchange antennas without affecting path or alignment.
Figure 17 shows the results of the three-antenna method. For the two identical horns, good agreement with the two-antenna method is apparent from Figure 16.
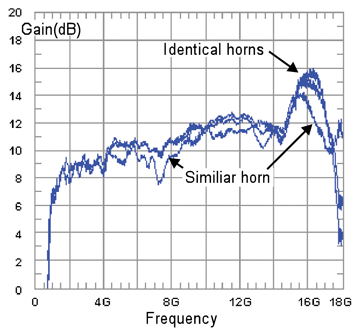
Figure 17: Three-antenna method resulting in the gain of each antenna
Conclusions
A novel, customized, antenna time-domain measurement has been presented as an alternative to the classical measurement techniques in frequency domain. The advent of high speed wideband vector analyzers utilizing IFFT make the single-antenna method simple and practical. A correction routine has been demonstrated to be an effective tool for measurement accuracy. Calibration lab measurement data was verified using two- and three-antenna methods of measurement. The mirror method with time domain was shown to have good agreement with the verified data. ![]()
Acknowledgement
It is the authors’ pleasure to acknowledge the innovation of colleague Matthew J. Martin and the cooperation and support of the Panashield team. We are particularly grateful to Anritsu Inc. for the use of test equipment and Sunol Sciences for the use of two identical horns.
References
- J. D. Young, D. E. Svoboda, and W. D. Burnside, “ A Comparison of Time and Frequency Domain Measurement Techniques in Antenna Theory” IEEE Transactions on Antennas and Propagation, July, 1973, pp. 581-583.
- R. Q. Lee, M. F. Baddour, “Absolute Gain Measurement by the Image Method under Mismatched condition”, International AP-S Symposium, June 15-19, 1987.
- R. V. de Jongh, M. Hajian, L. P. Ligthart, Department of Electrical Engineering, International Research Center for Telecommunications Transmission and Radar, IEEE Antennas and Propagation Magazine, vol. 39, No.5, October 1997.
- E. K. Miller, Time-Domain Measurements in Electromagnetics, New York, Van Nostrand Reinhold Company, 1986.
- Time Domain Measurements Using Vector Network Analyzers, Application note www.anritsu.com.
- E. M. Peucell, “A method for Measuring the Absolute Gain of Microwave Antennas” RL Report No. 41-9.
- Ramo, Whinnery And Van Duzer, “Fields And Waves In Communication Electronics, John Whiley & Sons, Inc. 1967.
 |
Michael D. Hillbun is president of Diamond Engineering, manufacture of antenna test systems since 1991. Mr. Hillbun received his bachelor’s degree in 1971 and went on to receive his Master’s degree in Quantum Electronics from University of California Berkeley in 1973. Mr. Hillbun holds antenna coupler patents from Lockheed Missiles & Space and was the first to commercially program a microcomputer for microwave circuit simulation in 1982. In 1994 Mr. Hillbun’s 10MBs packet radio won first prize at Interop and was responsible for one of the first wireless lan startups, RadioLan Inc. Mr. Hillbun has extensive background in both military and commercial microwave components. He can be reached at mikehill@diamondeng.net. |
 |
Matthew J Martin is a technologist in software and mechanical development. He is currently vice president of Diamond Engineering and has 10 years’ experience in antenna platform control and measurement software development. Mr. Martin is responsible for the special projects department and has innovative motion control systems around the world. Mr. Martin is currently working toward his bachelor’s degree in electrical engineering. |
 |
David Seabury is the Director of Sales~Americas for Panashield Inc. David has an extensive background in the design, manufacture and installation of RF shielded enclosures and anechoic chambers for EMC, wireless and microwave applications. His background includes founding IBEX Group, Chase EMC USA and Chase Systems where he promoted a range of products synergistic with chamber installations. IBEX and Chase were closely partnered with Panashield from 1991 until 2003. |