
Introduction
Most engineers are familiar with near-field probes and that they are sensitive to E- or H-fields emanating from circuit boards, cables or enclosure seams. They are really the first order of business when evaluating a circuit board or system. A more advanced characterization technique is to not only identify the major energy sources, but to interpret different emission types observed. That’s the purpose of this article.
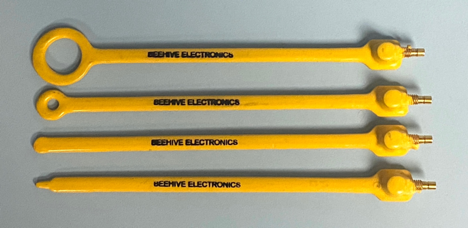
Figure 1 shows a standard set of four probes from Beehive Electronics. The pointed one is an E-field probe, while the three circular examples are H-field probes in various loop diameters.
A set of near-field probes may be obtained from many other sources, including Aaronia AG, Com-Power, Langer EMV-Technik, Rigol, Rohde & Schwarz, and Siglent.
Selecting the Right Probe
When would you use an E-field probe versus an H-field probe?
Circuits that produce a fast-changing voltage are usually higher-impedance circuits and so tend to produce a dominant E-field. You’ll typically find this at the switch node of DC-DC converters or in the high voltage switching loop of an off-line power converter. E-fields are also produced within leaky enclosure seams.
Circuits that produce a fast-changing current are usually lower-impedance, so they tend to produce a more dominant H-field. Examples include most circuit traces on PC boards or interconnect cables. Because H-fields typically dominate in PC boards, I tend to use an H-field probe to characterize emissions of various sources.
Why typically three sizes of H-field loops? It boils down to sensitivity and field pick-up resolution. The larger H-field probe is most sensitive to detecting H-fields but has lower resolution; that is, it’s more difficult to “zero in” on particular circuit traces that may be carrying noise currents. The smallest diameter H-field probe can resolve noise currents down to specific traces in many cases, but the sensitivity is low enough that you may need a broadband preamplifier to boost the signals for better observability.
Probing around on PC boards and cables can reveal the major EMI sources of harmonic energy and is always a good first step. But many designers may have trouble progressing from that point and really understanding what it is they’re seeing and what to do next.
Broadband versus Narrowband
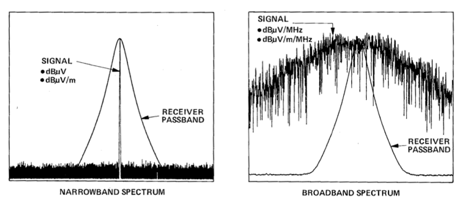
I introduced the broadband (BB) versus narrowband (NB) concept in Bench Notes 3, and I’d like to dig a little deeper now. First, we need to better understand the difference between BB and NB harmonic emissions. Second, we need to realize that whether harmonic signals are considered BB or NB depends on the EMI receiver or spectrum analyzer receiver passband (that slice of frequency spectrum to which the analyzer is responding, often referred to as resolution bandwidth (RBW)). See Figure 2 for clarification.
The traditional definition of broadband is a signal that produces “noise” across a wide band of frequencies. For example, thermal noise from a resistor or “shot” noise from a semiconductor junction will produce a continuous band of energy across a wide range of frequencies. In the audio world, this might be called “white” or “pink” noise.
The more likely cause on product designs today is fast-changing digital or power converter circuits. A good example is an on-board DC-DC converter that switches at only 1 MHz but has switching edge speeds (rise-/fall-times) of 1 to 3 ns or less. These fast edges create a broad spectrum of harmonic energy as high as 2 GHz.
A narrowband signal in the traditional sense would be observed as discrete harmonic “spikes,” and you’d see one or more depending on the RBW setting of the spectrum analyzer.
In Figure 2, if the total energy of the harmonic being observed fits within the RBW, then it’s considered narrowband. If the harmonic energy is wider than the RBW, it’s considered broadband. This might seem to be a little odd in that the narrowband/broadband classification depends on how the measurement gear is set, but the basic concept is that broadband signals are wider than the receiver bandwidth (or RBW).
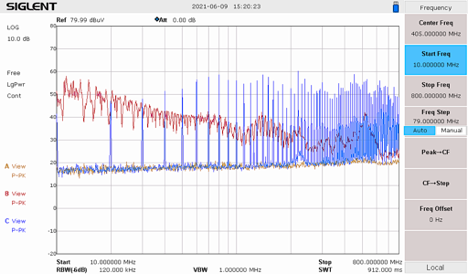
Figure 3 shows a combination of BB and NB emissions. Understanding how to interpret these emission profiles helps to identify the circuit causing it. What appears to be a rise in the measurement noise floor and tapering down gradually is considered a BB emission, while the series of narrow spikes is considered NB.
For the example above, I chose an RBW of 30 kHz for argument’s sake. We’re looking from 10 to 800 MHz with a log-frequency horizontal axis, which I tend to prefer, as it is quicker to identify particular frequencies.
Harmonic energy sources that produce a broad increase are generally created by fast-switching DC-DC converters. You’ll also see a broad rise in emissions from digital switching of address and data buses, often with NB spikes riding along. To visualize the envelope clearly, requires the use of MAX HOLD mode and waiting for the analyzer to perform multiple sweeps to fill in the gaps. Note that a real-time spectrum analyzer will not generally require multiple sweeps to record a clear BB signal.
What’s very interesting is that if we were to reduce the RBW down to a narrow 300 Hz to 1 kHz, we’d be able to resolve the DC-DC converter switching as a series of NB spikes separated by the converter switching frequency (typically 100 kHz to 3 MHz nowadays). This demonstrates that whether a harmonic signal is considered BB or NB, depends on the RBW setting of the analyzer.
So that we don’t get bogged down in interpreting whether a signal is considered BB or NB, the EMC standards always define the measurement RBW depending on the frequency band being measured. For example, in the non-military world, we generally use Table 1. For MIL-STD, we replace 9 and 120 kHz with 10 and 100 kHz.
| RBW | Freq Band |
| 9 kHz | 9 kHz to 30 MHz |
| 120 kHz | 30 to 1000 MHz |
| 1 MHz | >1 GHz |
Table 1: Resolution bandwidth versus frequency according to most commercial EMC standards.
In fact, unless you elected to get the “EMI Option” for your spectrum analyzer, you may not be able to select the 9/120 kHz RBW settings. Just use 10/100 kHz, instead, as that is close enough for troubleshooting or debugging efforts.
Examples of Emission Profiles
The ability to interpret the emission profile of various harmonic energy sources will greatly help in tracing back to the source and beating down radiated or conducted emission challenges for your product. For example, when I see a family of NB spikes, I immediately think of a digital clock. If I see a BB profile, I immediately suspect an on-board DC-DC converter or digital bus noise currents.
By characterizing the dominant harmonic energy sources in advance, you should be able to take the observed radiated or conducted emissions and backtrack to the source. All examples below are using an RBW of 120 kHz, and I usually find the middle-sized H-field probe to be best.
Figures 4 through 6 demonstrate examples of harmonic profiles I’ve commonly seen for different on-board sources. These emission profiles should be carefully recorded for comparison to emission failures during pre-compliance or compliance testing.
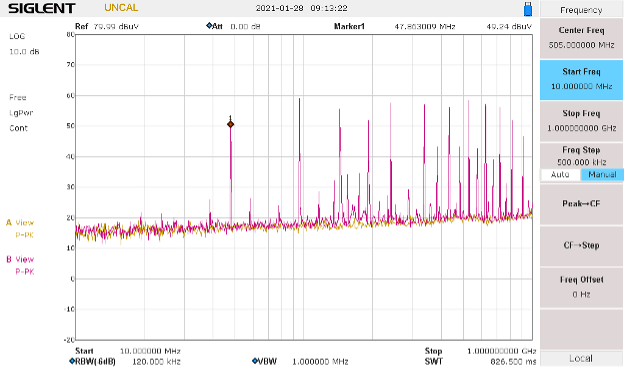
Figure 4 is a frequency sweep from 10 to 1000 MHz, showing an example of a narrowband 48 MHz fundamental clock with harmonically-related spikes every 48 MHz. This can be confirmed by subtracting the frequencies from any two adjacent spikes. Using a log-frequency sweep helps to visually identify frequencies.
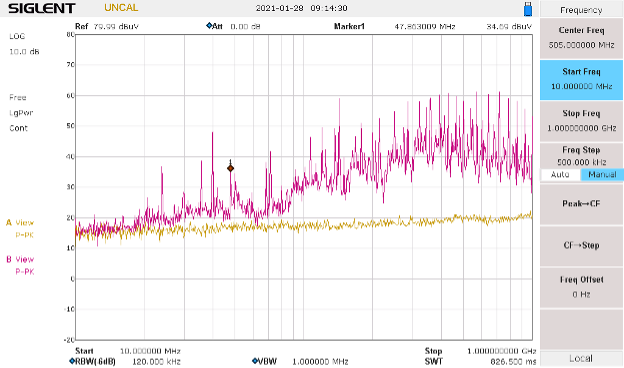
In Figure 5, and sweeping over the same frequency range, we see an example of broadband digital bus noise with narrowband clock spikes riding on top. The peaking around 400 MHz could indicate a cable and/or board resonance. Note that it’s common to have a combination of narrowband emissions riding along on top of a broadband emission.
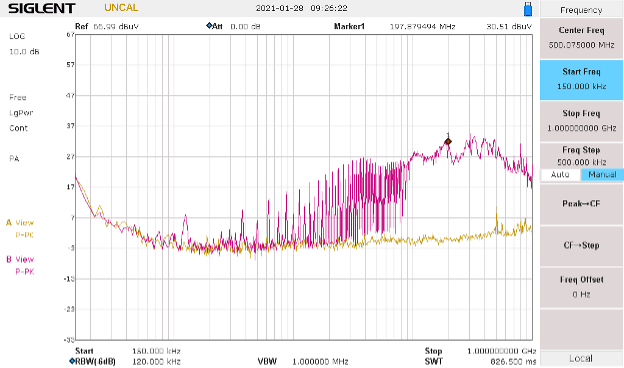
In Figure 6, we’re now sweeping from 150 kHz to 1 GHz, and we observe typical broadband DC-DC converter noise. This was captured using MAX HOLD mode. The broad peak from 200 to 300 MHz is likely due to cable and/or PC board resonances. This self-generated EMI can couple to sensitive wireless receivers and cause lack of sensitivity.
Summary
By first identifying the major energy sources and characterizing their emissions profiles, it is possible to correlate particular conducted or radiated emissions with the source or sources on the PC board (or within the system) that could be the root cause. Future Bench Notes will bring in additional tools and probes to help this process.
References
- Wyatt, Workbench Troubleshooting EMC Emissions, Volume 2, Chapters 3 and 4.