Assessing the Potential for Damage
Generally, the effect of lightning on an information and technology (ICT) loop that we worry about most is damage, which can occur in four ways:
- By induction from a nearby strike
- In a system with more than one ground
- By a direct strike
Let’s consider an ICT loop that is probably the most exposed to the effects of lightning – one that runs between structures.
The Model
As illustrated in Figure 1, assume that we have two structures separated by a distance W from point A to point B; and assume that there is an ICT line running at an average height above ground l between the two structures. A loop is then formed by the ICT line, the ICT circuit to ground at each end of the line, and the ground resistance.
Potential Damage From Indirect Effects
Induction from a nearby strike
In this case, we want to calculate the amount of current induced in a loop by a lightning flash, here represented by the long straight wire shown in Figure 2.
To do that we need to first calculate the mutual inductance between the wire and the loop. To calculate the mutual inductance M, we first need to know the magnetic flux through the rectangular loop. Using Ampere’s law, the magnetic field at a distance r away from the straight wire is:

The total magnetic flux ΦB through the loop can be obtained by summing over contributions from all differential area elements dA = ldr. The vector product of dA and B is maximized when they are in the same direction, such that B ∙ dA. In that case the maximum value of ΦB is:
Then the maximum mutual inductance is the maximum flux divided by the current:

To get an estimate for M, let the height of the loop l be 3 m, the distance W between the two structures 30 m, and assume the lightning flash is S = 30 m away. Then from equation (3), where µ0 = 4π x 10-7 H/m,
M = 1.4×10⁻⁶ Hy
Loop current is generally very small, since the resistance to ground of the ICT circuits is usually very large, unless the insulation breaks down. To see if enough voltage is generated to break down the insulation, the voltage developed across a very high resistance can be estimated using equation (3), assuming a double-exponential lightning surge as characterized by equation (4),

Then using equation (4),

where M is given by equation (3) and the assumptions following it.
Let the lightning be the median 30 kA 5.5/75 surge from CIGRE TB549 Table 3.5. Then in equation (5) a = 1×10⁴, b = 8.1×10⁵, Ipeak = 3×10⁴ A. Using the calculated value 1.4×10⁻⁶ Hy of M, the resulting peak voltage is about 33 kV, which is likely to be enough to cause insulation breakdown. If that happens the impedance Z of the loop becomes the combination of resistance between the two grounds plus whatever resistance is present in the ICT circuits, and the inductance of the ICT line. In that case the loop current as a function of s = jω is:

Now let’s look at the components of Z: The inductance of the ICT line LC, the resistance of the ICT circuit to ground at each end of the cable, and the resistance between the two grounds. Compared to the other resistances in the circuit, the resistance of the ICT line is negligible, so Z =RS +jωLC, where RS is the sum of the resistance of the ICT circuit to ground at each end of the cable RC, and the resistance between the two grounds. From IEEE Std. 142-1991, the resistance R between two ground rods of length L and radius a, spaced a distance W apart, in soil of resistivity ρ is:

To get an estimate of the resistance of the two grounds, assume ρ = 300 ohm-m, W = 30 m, L= 2 m, and a = .01 m. Substituting the numbers in equation (7) gives R = 81 ohms. To get an estimate of the inductive component of Z, assume that the ICT line is a 30 m length of two #22 AWG wires in parallel, for which the inductance is about 33 µH. Again let the lightning surge be the median 30 kA 5.5/75 surge from CIGRE TB 549 [1] Table 3.5, so that a = 1×10⁴, b = 8.1×10⁵. For the waveform assumed, the maximum value of jωLC is 0.29 ohms at 8.9 kHz, very much less than RS. So for practical purposes jωLC can be neglected, and Z = RS. To get V(s) for equation (6) take the La Place transform of equation (5), which is:

Substituting equation (8) in equation (5) we have

Taking the inverse La Place transform of equation (9) we have

Now using the numbers previously assumed (including a ground resistance of 81 ohms), we can calculate the peak loop current as a function of ICT circuit resistance. The result is plotted in Figure 3.
However what we really want to know is how much energy is deposited in the ICT circuits, because that causes them to heat up and possibly be destroyed. That energy, J is

From equation (10)
Substituting equation (12) in equation (11) and doing the integration
Evaluating equation (13)
Equation (14) can be used to generate values for the energy plot shown in Figure 3.
For a given set of values for the variables, the plot can be used to find the amount of energy deposited in the ICT circuit for any chosen value of circuit resistance. For example in the present case, an Ethernet circuit with 75 ohm terminations at each end would have about 1 J deposited in each resistor. How hot would the resistor get in response to a 1 J heat input?
Using equation (14), for an adiabatic process the temperature rise is given by

Where ∆T is the temperature rise in oC, cp is the heat capacity in Joules/(gram-oC), and m is the mass in grams. The heat capacity for silicon and ceramics is around 0.85 ±0.05 J/goC. Chip resistors vary in mass depending on size, but 0.1 g might be typical. Putting these numbers into equation (15) along with a 1 J heat input yields a temperature rise of about 11 oC, unlikely to be a problem. However ∆T depends on (MIpeak/RS)2, so, for example, any change in M, Ipeak or RS that causes MIpeak/RS to be a factor of 4 higher increases ∆T by a factor of 16, which in the example yields a temperature rise of about 180 oC. At a minimum, a temperature rise of this much might cause the resistor to crack, since this is thermal shock.
Figure 3 is only for a median first stroke. In reality, a lightning stroke is composed of a first stroke and typically 4 subsequent strokes. The subsequent strokes contribute heating energy to any resistances in the circuit, so it is of interest to estimate how much energy that is. From CIGRE TB 549 the median subsequent surge is 12 kA 1.2/32, for which a = 2.27×10⁴ and b = 3.73×10⁶. Putting these values into equation (15) along with the previously assumed values for the other variables (including a ground resistance of 81 ohms), the current IW(t) for a subsequent stroke can be calculated. The peak of this current is plotted as a function of the circuit resistance RC in Figure 4. Then using the calculated iW(t) in equation (11), the amount of energy deposited in the ICT circuit for any chosen value of circuit resistance can be calculated. The result is plotted for a single stroke in Figure 4.
To continue the previous example, an Ethernet circuit with 75 ohm terminations at each end would have about 1.4/2 = 0.7 J deposited in each resistor, due to a single subsequent stroke. Depending on the time of occurrence of the components of the flash, the energy in the first stroke and subsequent strokes might accumulate. So for the 4 typical subsequent strokes, the amount of energy deposited in a 75 ohm Ethernet termination if no dissipation occurs is 4×0.7 = 2.8 J.
In a worst-case the energy from the subsequent strokes adds to that from the first stroke to give a total of 3.8 J, causing a temperature rise of 42 oC in the present example, likely not a problem.
The amount of energy deposited in RC might be more or less than those just calculated, depending on the waveform of the lightning strokes and the circuit characteristics. For example, if the lightning strike is 10 m away instead of 30 m, the total worst-case energy goes to 15.4 J, for a temperature rise of 170 oC.
The result of all this effort? Damage from induction might be a problem, but most likely not the main issue.
The energy due to induction will add to that due to ground current rise (GCR), which we will consider next.
Ground potential rise (GPR) and ground current rise (GCR)
In the case of a uniform ground, the current density from a lightning flash spreads out from the point of contact of the flash. The voltage created by the spreading flash current density decreases as the distance from the flash increases, as illustrated in Figure 5. The result is that the ground potential at a point closer to the flash, e.g., point A in Figure 5, is greater than the ground potential at a more remote point B, hence there is a difference in potential due to a GPR between points B and A.
This model is an oversimplification, since the equipotential map is site-specific, and can be quite irregular. But at least the model allows a calculation of the effects of GPR.
So referring to Figure 5, suppose there are 2 structures as illustrated in Figure 1, one with ground conductor located at point A, and one with a ground conductor located at point B. As in the previous examples, let point A and point B be connected by an ICT circuit having a resistance RC. An equivalent circuit for this arrangement is shown in Figure 6. Here R1 is the resistance of the earth between the flash striking point and point A, R2 is the resistance of the earth between the flash striking point and point B, R3 is the earth resistance between point A and a remote ground, and R4 is the earth resistance between point B and a remote ground. IF is the current due to the lightning flash.

Analyzing the equivalent circuit, the current in the ICT circuit, I5 due to a GPR can be expressed as:

Where RT = R1 + R2 + R3 + R4
Let r0 be the radius of the area where the lightning flash strikes, let r1 be the distance from the lightning flash striking point to the ground at point A, and let x be the distance of the point A ground from the point B ground (see Figure 1 and Figure 5). Then R1 is the resistance of the green area in Figure 7 between r0 and r1; and R3 is the resistance of the yellow area between r1 and remote earth.
Similarly, R2 is the resistance of the gray area in Figure 8 between r0 and r1 + x; and R4 is the resistance of the blue area between r1 + x and remote earth.
Let ρ be the resistivity of the ground. Then using the guidance of IEEE Std.142:1991,


Substituting equations (17) – (21) into equation (16) we get equation (22)
where RS is the sum of all resistances between the two ground points (circuit resistance, resistance of the ground at A, and the resistance of the ground at B). As previously noted the inductance of the ICT circuit jωLS can be neglected, as it is small compared to RS.
Assuming IF is described by a double exponential,

where

As before, what is of most interest is the energy deposited in RC. Similar to the previous expression for J

Using the expression for I5(t)
Which evaluates to
Referring to Figure 9, assume that the ground is ionized over the patterned area on the green, and that the man’s feet are a foot apart.
With these assumptions, r0 is estimated to be 2.4 m (the calculation is not very sensitive to this number). Some typical numbers to use in equations (17) – (21) are:
r1 = fixed at 30 m, or an X-axis variable when Rs is fixed
RS = When r1 is fixed, an X-axis variable equal to RC plus the 81 ohms previously calculated for the resistance of the ground rods, or a fixed at 81 ohms.
x = 30 m
ρ = 300 ohm-m
These numbers determine the values for G1, G2, G3, G4 and GT.
Assume IF in equation (22) is described by a double exponential,

Using the values determined for G1, G2, G3, G4 and GT, and assuming the lightning stroke lightning is the median 30 kA 5.5/75 surge from CIGRE TB549 Table 3.5, for which a = 1×10⁴, b = 8.1×10⁵, Ipeak = 3×10⁴ A, gives values for the plot of current I5 vs r1 shown in
Figure 10, and I5 vs or RC shown in Figure 11.
But again what is of most interest is the energy deposited in RC. Similar to equation (11),

Substituting equation (28) into equation (29) we have
Integrating equation (30) we have:
Which evaluates to:

Equation (32) can be used to add a plot of J vs r1 to Figure 10, and J vs RC to Figure 11.
Figure 10 has two plots. The first shows the surge current that could flow in the ICT due to a GCR as r1, the distance of the lightning strike from Structure #1, is varied – up to 260 amps in this case for a total ground resistance of 81 ohms as previously calculated. For this example, the ICT circuit is assumed to be an Ethernet loop with 75 ohm Smith terminations at each end, for an Rc of 150 ohms. The second plot shows the energy delivered to each termination as r1 is varied. The voltage across each ICT termination can reach 17 kV, if the lightning stroke is close to the loop.
Figure 11 is a plot of equations (28) and (32) as RC is varied, with r1 = 30 m, ground spacing = 30 m, and ground resistance of 81 ohms. The energy delivered to the termination is probably too low to be a problem.
Figure 12 shows what can happen if a lightning strike is close to the ICT circuit. It is similar to Figure 11, except that r1 = 10 m. In this case, the energy delivered to the termination might be a problem.
In addition to energy, voltage across the ICT terminations might be an issue. For example, the voltage that might be developed across a 75 ohm Ethernet termination for the case considered (ground spacing = 30 m, and ground resistance = 81 ohms) is
3800 V for r1 = 30 m
17000 V for r1 = 10 m
The peak currents, energy and voltage in the two cases considered were calculated for a median lightning stroke, and could be more or less than those shown, depending (among other things) on the peak current of the lightning stroke and the length of the ICT circuit.
Again assuming an adiabatic process, the energy J causes the temperature ∆T of a device to rise above ambient according to
where m is the mass of the device in grams and cp is the heat capacity in Joules/(gram-oC). For a device made from ceramic or silicon, cp is 0.85±0.05.
As an example, taking a peak energy of 200 J from Figure 12, ∆T = 235o C per gram of device weight. So a small device like a chip resistor could get hot enough to be destroyed.
Lightning Direct Strike
Although it would be a rare event, it’s interesting to see what would happen to the loop wire if it were hit by a direct strike.
From [2] for copper wire
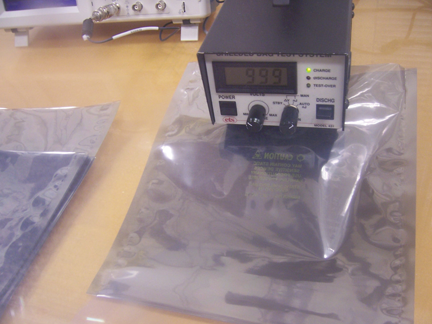
Where d = diameter of the copper wire in mils. For a double exponential lightning surge of time-to-half peak = τ,
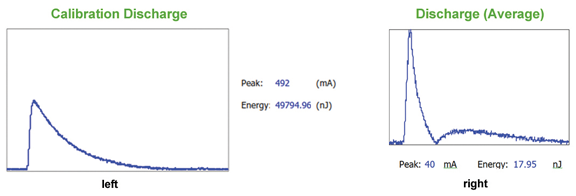
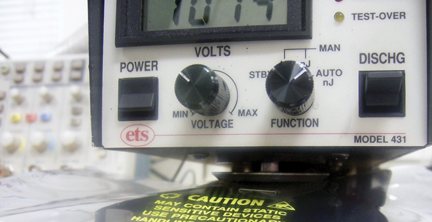
From Wikipedia
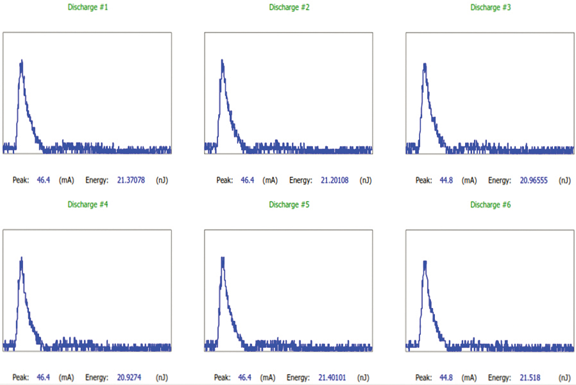
Knowing Ipeak and τ, the largest diameter of a wire that would fuse is given by equation (36), and the corresponding AWG by equation (37). Thus any AWG with a number higher than that calculated from eauation (37) would fuse by the chosen lightning flash. For example for a median 30 kA 5.5/75 stroke, any AWG with a number equal to or higher than 19 would fuse.
The Issue of Multiple Strokes and Continuing Current
Up to this point only a flash having a single stroke has been considered. These are rare. According to CIGRE TB549 a typical negative cloud-to-ground flash is composed of 3 to 5 strokes (leader/return stroke sequences), with typical interstroke intervals of some tens of milliseconds. The largest number of strokes in a flash reported in CIGRE TB549 clause 2.5 is 26, although no upper limit has been established. MIL-STD-464 Annex A5.4 [3] describes an extreme multisurge environment consisting of a 200 kA 6/69 first stroke followed by 23 50 kA 3/35 subsequent strokes spaced 10 to 200 ms apart.
Flash strokes do not always occur in the same place. According to CIGRE TB549 clause 2.7, one-third to one-half of all lightning discharges to earth, both single- and multiple-stroke flashes, strike ground at more than one point with the spatial separation between the channel terminations being up to many kilometers. The worst case is to assume that all strokes hit in the same place.
Figure 13 (adapted from [4]) illustrates the case of multiple strokes, and also includes continuing current (which can last from a millisecond to hundreds of milliseconds).
MIL-STD-464 Annex A5.4 Figure 1 shows an extreme case where a first stroke can transfer 10 C, a subsequent stroke can transfer 2.5 C, and continuing current can transfer 200 coulombs (400 A for 0.5 s).
Depending on the interval between strokes and the thermal time constant of a device, the thermal energy due to the strokes might accumulate in the device, which could impact its functionality. This view gets support in a paper by Rousseau et al [5] in which a MOV was subjected to 60 20 kA 8/20 surges spaced 60 seconds apart, with no failure. But when the same type of MOV was subjected to as few as 5 20 kA 8/20 surges spaced 50 ms apart, failure occurred. MOVs have a long thermal time constant, which allows energy build up with closely-spaced surges, possibly resulting in failure due to temperature rise in the MOV. A multi-surge burst also delivers repeated mechanical shocks to the SPD being tested (the “jackhammer effect”), and in the case of a MOV this mechanical stress might combine with the stress due to energy accumulation to cause failure. SPDs based on silicon technology generally have short thermal time constants, so heat accumulation in these devices is not expected to be an issue.
To show how the thermal energy due to a flash consisting of a first stroke and subsequent strokes accumulates, consider this excerpt from post #20 by Maytum [6] on the SPDC web site, entitled “8/20 burst MOV energy:”
“The ten350 site documents 8/20 burst testing of SPDs. The most stressful test consisted of seven 8/20 impulses applied in an amplitude sequence of 100 kA, 50 kA, 50 kA, 50 kA, 50 kA, 50 kA and 100 kA. The time between each impulse was 30 ms.”
![Figure 14: Single 100 kA 8/20 plot. The 100 kA 8/20 energy step is 2600 J [6].](https://assets-incompliancemag-com.s3.amazonaws.com/2023/12/1311_F2_fig7-1.png)
![Figure 15: Single 50 kA energy plot. The 50 kA 8/20 energy step is 1080 J [6].](https://assets-incompliancemag-com.s3.amazonaws.com/2023/12/1311_F2_fig8-1.png)
Continuing the excerpt, “the thermal time constant of an MOV appears to be more in the seconds region, unlike silicon junction semiconductor whose chips are in the millisecond region. A MOV long thermal time constant means that the energy of all the impulses cumulatively adds, resulting in an energy staircase.”
![Figure 16: Burst energy plot [6]](https://assets-incompliancemag-com.s3.amazonaws.com/2023/12/1311_F2_table2-1.png)
As Maytum finally observes, “the cumulative energy is 10600 J and the equivalent pulse period is 180 ms.” A MOV selected for this application would need to be rated at 10600 J or more.
The example above is an extreme case, but it illustrates the concept of energy buildup in an SPD. A more practical example has been described by Maytum [7] in which he notes that a paper by Yang et. al. [8] reported that a 40 kA SPD stopped functioning at lightning currents no greater than 1.6 kA. Why? Analysis of the data suggested that the cause might be accumulation of thermal energy delivered by the 350 A, 0.5/29.5 first stroke followed by eight return strokes ranging from 0.22 kA to 1.64 kA with a geometric mean waveshape of 15.6/63.3. By itself this accumulated thermal energy might not have been a problem; but added to this energy was that from several impulses which showed a continuing current content lasting some 3 ms and delivering 100 J. This added 100 J probably pushed the SPD beyond its capability.
So to summarize, the important thing to consider is the amount of thermal energy deposited in a device by all components of the flash, that is, first stroke, subsequent strokes, and continuing current. In particular, an SPD chosen without consideration of energy may be undersized, as the example just cited shows.
Survivability
The following are observations on things that could affect the survivability of a device:
Considering only a first stroke generally underestimates the energy J deposited in a device. Over 80% of all cloud-to-ground lightning flashes consist of multiple impulses, 3 – 5 on average. Multiple impulses are the most representative of all lightning characteristics, but one that has not generally been addressed in the international lightning protection standards.
Nearly all lightning flashes contain continuing current, the effects of which can be much greater than the effects of first and subsequent strokes. Lightning protection standards typically do not consider continuing current.
Lightning protection standards generally give SPDs time to cool down between strokes. However, lightning is composed of multiple strokes with a range between the individual strokes generally between 30ms and 60 ms. So allowing more than 60 ms between strokes for the SPD to cool generally results in undertesting it.
Summary
Damage to a device is generally due either to temperature rise from the energy deposited in the device or to flashover. Energy deposited in a device due to induction from a lightning flash is not likely to be high enough to cause a problem, except when the lightning current is extremely high, or very close to the ICT circuit. Flashover might be a problem if the impedance of the ICT circuit is high
Energy deposited in a device due to GCR might be sufficient to cause damage. Again this is more likely to happen if the lightning current is extremely high, or very close to the ICT circuit. The voltage developed across the ICT terminations due to GPR could be enough to cause flashover.
Lightning generally consists of a first stroke and four or more subsequent strokes, and may also have continuing current. The important thing to consider is the amount of thermal energy deposited in a device by all components of the flash, that is, first stroke, subsequent strokes, and continuing current. In particular, an SPD with a long thermal time constant, such as a MOV, chosen without consideration of energy may be undersized.
References
-
- CIGRE Working Group C4.407, “Lightning Parameters for Engineering Applications,” CIGRE TB 549, 2013.
- Kenneth C. Chen, Larry K. Warne, Yau T. Lin, Robert L. Kinzel, Johnathon D. Hu, Michael B. McLean, Mark W. Jenkins, and Brian M. Rutherford, “Conductor Fusing and Gapping
for Bond Wires,” Progress In Electromagnetics Research M, Vol. 31, 199-214, 2013 - MIL-STD-464, “Electromagnetic Environmental Effects Requirements for Systems”, AMAC A7252, 1997
- Rakov, V. A., “Lightning Parameters of Engineering Interest: Application of Lightning Detection Technologies,” in EGAT, Bangkok, Thailand, November 7, 2012.
- Rousseau, A., Zang, X., and M. Tao, “Multiple shots on SPDs – additional tests”, in
2014 Int’l Conf. on Lightning Protection
(ICLP), Shanghai, China. - Maytum, M.J., “Knowing your lighting ABCD Part 2,” ©2011, http://pes-spdc.org/content/ten350-web-site?page=1. Reprinted with the permission of the author.
- Maytum, M.J., “Technical Bulletin (TB) 549 (2013) Lightning Parameters for Engineering Applications,” in The Alliance for Telecommunications Industries Solutions Protection Engineers Group, Littleton, CO,
March, 2014. - Yang, Shao-Jie, S-D Chen, Y-J Zhang, W-S Dong, J-G Wang, M. Zhou, D. Zheng, and H. YU Hui. “Triggered Lightning Analysis Gives New Insight into Over Current Effects on Surge Protective Devices,” www.ten350.com/papers/icae-conghua.pdf
