Thermal testing, also known as heat testing, is one of the most critical tests required by the majority of regulatory safety standards in determining the safety of a product.
Excessive heat is the number one enemy in any electrical or electronic circuit. Designers are perpetually trying to improve the way to reduce heat or partially cool their products because they are being asked to design products with higher power density into smaller sizes, while operating temperatures of components or devices have not changed greatly over the past few decades. This means that component temperatures must be well controlled to avoid any failure and to increase the reliability of the product.
This article will cover basic fundamentals for thermal measurement and provide some of the methodology used to arrive at accurate measurements.
Choosing a Thermocouple
Accurate temperature measurement of components can be challenging. An important tool used in thermal measurement is the thermocouple, one of the most accurate and repeatable.
Although there are many devices or methods used for measuring temperature, thermocouples are one of the simplest and most commonly used sensors. Having said that, using an infrared camera can quickly help identify any hot spot.
Thermocouples consist of two wires of dissimilar metals, joined near the measurement point or junction (Figure 1). The output is a small DC voltage measured between the two wires. This differential voltage is then converted to a temperature using specially designed equipment such as a chart recorder or data logger.

Figure 1: Thermocouple composition
There are over a dozen different types of thermocouples commonly used in various industries. Most of these have been given internationally recognized letter designator types, such as B, C, D, E, G, J, K, L, M, N, P, R, S, T, and U.
Types J, K, and T are among the most commonly used thermocouple types in the electronic industry due to their ease of use, low cost, and availability. Each thermocouple has its own temperature range and accuracy. For example, the range for type J thermocouples is –210°C to +750ºC, while for type T the range is –100°C to +350ºC; for this reason, they are used for different applications. These temperature ranges are approximate because manufacturers state slightly different numbers. They also have different color codes. For example, in North America a type J is white and red, but in the rest of the world a type J is typically black and white.
The following is a list of recommendation that must be considered before taking any thermal measurements:
- Choose the thermocouple based on your application — expected temperature, environment, abrasion, oil, etc. For example, if you are measuring temperature of a component in a furnace, it is best to use a type C thermocouple.
- Ensure that the chart recorder or data logger is compatible with the thermocouple wiring. If you are using type K, ensure that the data logger is also set to type K. An incorrect setting will result in measurement errors.
- Visually and physically check the outer jacket for any obvious damage by running the thermocouple wires through your hand and feeling for any possible damage.
- Visually check the tip. The smaller the weld tip, the more accurate the results will be. Figure 2 illustrates two different weld tips.
- A good weld has a small tip with a very small amount of wire stripped, whereas a poor weld shows the opposite.
- Check each thermocouple for its functionality. Valuable time can be wasted if the thermocouple is damaged or is not functioning correctly after it is affixed to a component. One of the easiest methods is to hold each thermocouple between your thumb and index finger for a few seconds. The thermocouple should read your body temperature (37ºC).
- Take care when using thermocouples in a noisy environment or when attaching them to windings of a transformer. Thermocouples typically have no shielding and can be susceptible to EMI noise. Measuring magnetic temperature can be tricky, in particular when measuring switching transformers. The closer the thermocouple tip is to the windings, the more accurate the results are. However, it is best if the thermocouple tip is not touching the magnet wires directly since some of the windings carry high voltages and this may damage the data logger if it comes in contact with the thermocouple. The safest approach is placing the thermocouple tip on insulation tape, which covers the winding. One of the best ways to overcome an electrical noise problem is to use a thermocouple with shielded leads and connectors or to rout it away from noisy circuits.
- Ensure that a thermocouple is calibrated.
- When repairing and welding a thermocouple, it is critical that the weld tip is carefully checked to ensure the weld is secure and that the thermocouple is recalibrated prior to use.
- Avoid using a thermocouple with long lead length. High resistance in the wire may lead to errors. Use an appropriate extension wire and adapter, if longer length is needed.
- Avoid performing thermal testing in an uncontrolled environment, high traffic area, or areas exposed to any air-conditioning. Excessive air movement will impact the final results.

Figure 2: Good weld vs. poor weld
Measuring Techniques
The following factors may affect the final results:
- Position of the thermocouple: Critical when measuring temperature on the winding of a choke or transformer. The results are more accurate the closer the thermocouple is placed to the windings.
- Use of excessive glue or cement: Extra volume and mass can assist heat transfer, in particular when temperatures are close to their limits. Use an exact dose of adhesive. When using adhesive, ensure that the adhesive possesses a high thermal conductivity.
- Obstruction of the airstream around the thermocouple wires.
- Equipment voltage: Temperature results usually vary as the input voltage to the equipment changes. For example, some units run hotter at 90 Vac, while others may run hotter at 264 Vac. It is recommended that the input voltage source is as stable as practical. Any small variations in input voltage will result in variations in temperature. Ensure voltage tolerances are taken into consideration, as each safety standard uses different tolerance percentages.
- Equipment load: Equipment load plays a crucial role in the final thermal results. In the majority of the cases, the higher the load, the higher the temperature on individual components. Most product safety standards require the equipment under test (EUT) to be loaded to its maximum normal operating load during the heating test.
- Local ambient conditions: As mentioned before, it is important that the thermal test is performed in a controlled environment. If there is excessive air movement, then the final results cannot be considered as accurate. One of the simplest solutions is to conduct tests in a corner of the lab where there is less traffic and there is no air-conditioning blowing cold air directly on the EUT.
- Stabilization or thermal equilibrium: In certain instances, engineers record the final data after a certain time, such as after one or two hours of operation. Since different products behave differently and reach their maximum temperature at different times, it is important to record the final data ONLY after the EUT has reached thermal equilibrium.
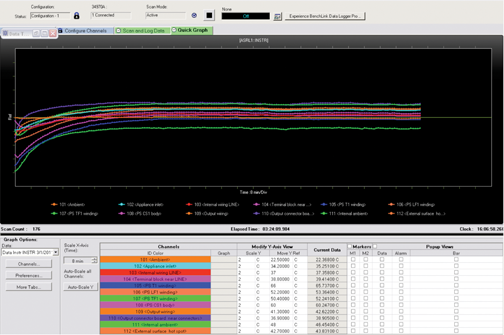
It would be helpful to explain what thermal stability is. A temperature is determined to be constant or stabilized when the graph on a chart recorder or data logger is shown to be flat without any temperature rise and shows three successive readings are within 1°C of each other when taken at 30-minute intervals. Unfortunately, there is no harmonized standard that defines thermal stability and each standard has its own definition. The most important point to bear in mind is that temperature rise is always an exponential curve. Therefore the easiest method is to use a chart recorder or data logger simply because the curve as temperature becomes stable is readily visible.
Figures 3 and 4 illustrate respectively measurements where thermal equilibrium has been achieved and where complete thermal stability has not been achieved.

Figure 3: Example showing thermally stable measurements

Figure 4: Example showing unstable temperatures
Documenting the Results
Before publishing the final results, take the following steps:
- Review the raw data to ensure that nothing unusual stands out. Use engineering judgment. For example if the body temperature of an metallic oxide varistor (MOV) is lower than that of the printed circuit board (PCB) on which it is mounted, the data should be checked again.
- Compare the test data to previous test data that has been done on the
- same product to find out if they all follow similar patterns.
- For almost each measurement of data, there is a limit to which the data is compared. These limits can be derived from verifiable sources such as product safety standards, component manufacturer data sheets, internal procedures, etc.
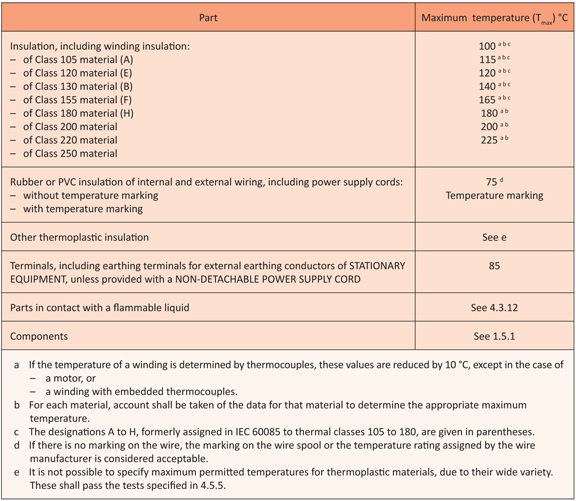
Tables 1 and 2, from IEC 60950-1, show the limits for some components.
- Prepare the final report by tabulating the data, correcting it to the corresponding Tmra (manufacturer recommended ambient), and include the limits for each component where possible.
- Prepare a complete report and ensure that all details (such as input voltage, load condition, amount and direction of any forced airflow, duration of test, and any other parameters that may be beneficial to the reader) are clearly documented.

Table 1: Temperature, limits, materials, and components

Table 2: Touch temperature limits
Computing Temperatures
Typically manufacturers market their products much higher than 25ºC. Based on the manufacturer’s recommended ambient temperature, also known as Tmra, either the limits or the measured temperatures must be corrected accordingly.
The formula below shows how to make the adjustment:
T < Tmax + Tamb – Tma
Where:
T = measured temperature
Tmax = maximum limit allowed
Tamb = local ambient
Tma = maximum ambient temp permitted by the manufacturer.
Example
An electrolytic capacitor is measured to be 63°C at a room ambient of 23°C. The capacitor is rated for 105°C and the manufacturer needs to qualify this product to 50°C operation. Does this component meet the required limits?
Using the above formula:
63 < 105+23-50
63 < 78
The component meets its permitted limit.
If the Tmra is higher than 25ºC, then the manufacturer has the choice of:
- Testing it on the bench in the lab and then mathematically correcting the temperatures as shown using the formula above
- Testing the product in an elevated environment, such as a heating oven
An oven is used when there is a specific request or the lab environment is unstable. When testing in an oven, accurately document the oven air temperature, level of oven air circulation, oven humidity, and sample placement. Additionally, an oven is used when the product is temperature controlled as stated in Clause 1.4.12.2 of IEC 60950-1, 2nd Ed. Most test agencies and standards allow both methods.
If the Tmra is 50°C or less, it is recommended that the testing is done on the bench. If the Tmra is higher than 50°C, then it is recommended that the testing is done in an oven.
Testing in an oven is typically exponential, where testing on the bench is typically linear when mathematically corrected.
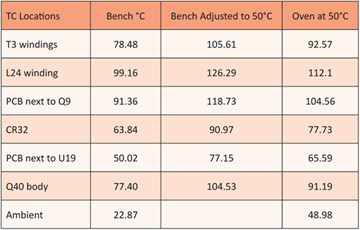
Table 3 shows the temperature results of an information technology equipment (ITE) product that was tested both on a bench as well as in an oven.

Table 3: Bench vs. Oven testing
Looking at Table 3, it is clear that testing on the bench and then mathematically correcting the values to the manufacturer’s stated Tmra is much harsher than when it is tested in a heating oven that was set to Tmra.
Determining Linear Feet per Minute
Another issue that designers sometimes face relating to thermal testing is the terminology used in some of power supply specifications. Some power supply manufacturers use the term cubic feet per minute (CFM), while others may use linear feet per minute (LFM) when a supply requires forced air cooling. CFM is a measurement of volume while LFM is a measurement of velocity. Most fan manufacturers use CFM, while board designers prefer to use LFM as this makes calculating thermal derating curve or power dissipation much easier.
LFM is equivalent to CFM divided by the cross-sectional area of interest.
The larger the cross-sectional area, the smaller the LFM for a given CFM, as shown in the formula below:
LFM = CFM/area (ft²)
Where:
area is the cross-sectional area of the opening which typically happens to be the fan box size in square feet.
if the fan is square, then the cross-sectional area is L x W.
if the fan is circular, then the cross-sectional area is πr².
Example:
A fan measures 40 x 40 mm and has a CFM of 5.2, then the LFM is calculated as:
1 mm = 0.00328 ft.
40 mm = 0.1312 ft.
40 mm² = 0.0172 ft²
LFM = 5.2/0.0172
LFM = 302 ![]()
References
- 60950-1: 2005 Information Technology Equipment – Safety – Part 1: General Requirements, http://www.omega.com
 |
Homi Ahmadi is the Compliance Engineering Manager at Extron Electronics in Anaheim, CA and has responsibility for Extron global regulatory compliance affairs. He has extensive background in compliance which includes product safety, EMC and environmental. He is a Sr member of IEEE and iNARTE product safety engineer. He has published numerous articles and conducted seminars both in the US as well as UK to aid manufacturers with product design and compliance activities. He is currently a member of IEEE Product Safety Engineering Society (PSES). He received his Bachelor’s Degree in Engineering from the University of Mid-Glamorgan in Wales-UK. He held the position of program chair at IEEE PSES in Orange County from 2008-2010. |
