
Walking out the door on any given weekday, heading to work, means making sure my collection of radios is either on my person or in my backpack. Let’s see, phone (four radios in there), laptop (two radios), tablet (two radios), keys (on radio), and Bluetooth ear buds (one radio). Getting in my car (a couple radios) I motor past dozens of home WiFi networks, all calling to my devices (when they’re on, that is).
As the testing industry shifts to more and more wireless device projects (and I’ve spoken with many an EMC lab that has pivoted from conventional EMC and CE testing to radio work) the device innovation has simply exploded over the past fifteen years.
This has meant that a lot of FCC Certification work has been done to approve these products. What has changed markedly is the complexity of these devices. Back in the “2G” days, a mobile phone may have a single band radio device, 802.11 devices typically were configured as single-band devices and Bluetooth ubiquity was still over the horizon. Now, we take all that connectedness for granted.
I got curious about the source of the devices being certified, that is, what countries were making these devices. Doing a search on the FCC’s Equipment Authorization System (EAS) makes this a quick task as one can view all the certification by country of origin.
(A note about search results and grants: by design, the FCC system “grants” a device for a specific Rule Part and purpose. Hence, a multi-function device may have multiple grants. It can carry the same FCC ID Number, however. What this means is that the number of Grants is higher than the number of individual devices; this is even more marked in recent years with very complex devices sometimes requiring five or more Grants to fully ‘describe’ the product. I only looked at Original Equipment grants, not Permissive Changes or Change in IDs).
The Data
I decided that comparing the trends over a decade would be reasonable, when I took a look at the grants issued worldwide and by region, comparing January to December 2004 with January to December 2014.
This is how it stacks up: The number of grants grew by a factor of 5, worldwide, from 2004 to 2014.
|
Region |
2004 |
2014 |
Growth Factor |
|
N. America |
2988 |
15145 |
5.1 |
|
Europe |
479 |
3034 |
6.3 |
|
Asia |
3163 |
14800 |
4.7 |
FCC Certifications by Region. 2004 and 2014
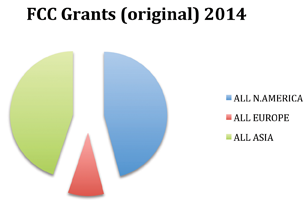
It’s reasonable to look at the world consisting of three major regions, according to the source of the Certifications in the world, so we take a look at North America, Europe and Asia. The number of grants produced from companies in these regions stayed proportionally the same, although the volume grew tremendously from 2004 to 2014. This is illustrated in the charts below. As one can observe the “shares” stayed about the same over the ten years.

What is curious is a deeper examination of the data for specific countries. Guess who grew the most in 10 years, relatively speaking?
Mexico! That’s right, Mexico native certifications grew by 286 times when comparing the data from 2004 and 2014. That’s not the whole story, of course. In 2004, a single Grant was issued to a Mexican company; in 2014, Mexican companies received 286 Grants. So much for statistics and a phrase popularized by Mark Twain: “There are three kinds of lies: lies, damned lies, and statistics.”
Other countries’ native certifications have surged as well, notably Sweden (21X increase from 69 to 1,437) and Spain (34X increase from 3 to 103).
The real story though, is China, which had a 25X increase in Certifications issued to Chinese companies from 327 in 2004 to a staggering 8,463 certifications in 2014. That’s real growth.
Digging further, it is curious to see the difference in the splits in Asia in general, as shown below.
|
Asia |
2004 |
2014 |
Growth Factor |
|
Japan |
417 |
816 |
2.0 |
|
Taiwan |
1238 |
3105 |
2.5 |
|
South Korea |
578 |
635 |
1.1 |
|
China |
327 |
8463 |
25.9 |
|
Hong Kong |
603 |
1781 |
3.0 |
|
ALL ASIA |
3163 |
14800 |
4.7 |
As is inferred from the numbers, it’s really China that is pulling Asia ahead in this area, noting that it’s the only Asia country with a growth rate higher than the global average.
Finally, if one looks at China + HK + Taiwan as a “Chinese block” it is interesting to see the expansion of the numbers of certification. These three economies account for 41% of the Certifications issued under the FCC System.

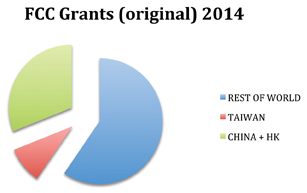
Note that there may be other nuances at play, particularly when looking at the data output from the FCC. The trends, though, underscore the remarkable burst of technical innovation that is coming from that part of the world.
 Mike Violette is founder of Washington Laboratories and American Certification Body. Mike can be reached at mikev @ wll.com.