
Foundations
In this article, we consider the effects of a discontinuity along the transmission line which occurs when the transmission line characteristic impedance changes from ZC1 to ZC2, as shown in Figure 1.
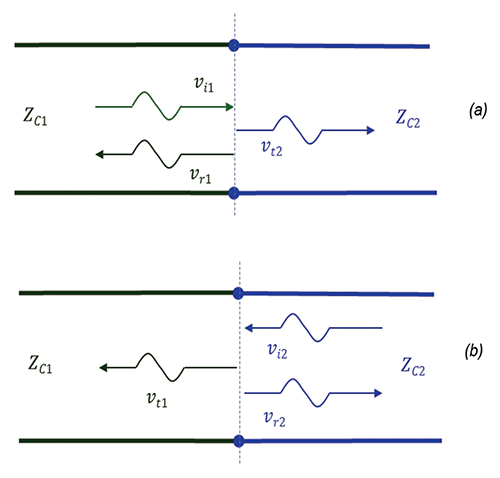
Let’s consider a voltage wave, vi1, traveling on transmission line 1 incident onto the junction, as shown in Figure 1(a). Upon its arrival at the junction the reflected wave, vr1, and the transmitted wave, vt2, are created.
The reflected voltage is related to the incident voltage by
![]() (1)
(1)
where Γ12 is the reflection coefficient for the wave incident from the left onto the boundary, given by
 (2)
(2)
The transmitted voltage is related to the incident voltage by
![]() (3)
(3)
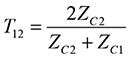
where T12 is the transmission coefficient from the left to the right, given by
 (4)
(4)
Similarly, for the wave incident on the boundary from the right, shown in Figure 1(b), we have
![]() (5)
(5)
![]() (6)
(6)
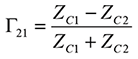
In this case, the reflection coefficient for the wave incident from the right is given by
 (7)
(7)
and the transmission coefficient for the wave incident from the right is
 (8)
(8)
Verification
The experimental setup and the circuit model for reflection measurements is shown in Figure 2. Its circuit model is shown in Figure 3.
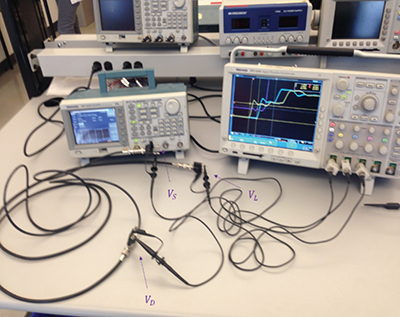
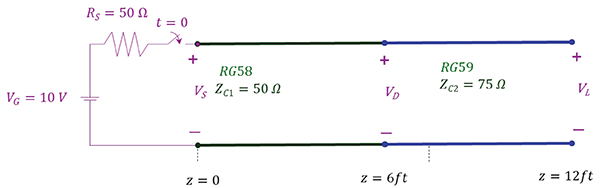
A 10 Vpp (open-circuit voltage) pulse signal was sent from the function generator along the 6 ft-long RG58 coaxial cable (ZC1 = 50 Ω) connected to the 6 ft-long RG59 coaxial cable (ZC2 = 75 Ω) and terminated with an open circuit. The rise time of the waveform is tr = 2.5 ns. The voltages at the source (VS), the discontinuity (VD) and at the load (VL) were measured using the oscilloscope probes.
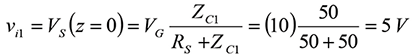
When the switch closes, the initial voltage wave is created at location z = 0. The value of this voltage is
After about t =T= 9 ns (one-way travel time along RG 58) this waveform arrives at the discontinuity where it gets reflected and transmitted. The reflection coefficient (from the left) at the discontinuity is

The reflected voltage at the discontinuity is
![]()
The total voltage at the discontinuity at t = T is thus
![]()
The reflected voltage wave propagates back towards the source and arrives there about at t = 2T later. The total voltage at the source becomes (after t = 2T+2tr).
![]()
The incident wave that arrived at the discontinuity at t = T is also transmitted. The voltage transmission coefficient for the wave incident from the left is

The transmitted voltage at z = 6ft is
![]()
which, of course, is the same as the sum of the incident and transmitted voltages at t = T. These voltages are shown in Figure 4(a).
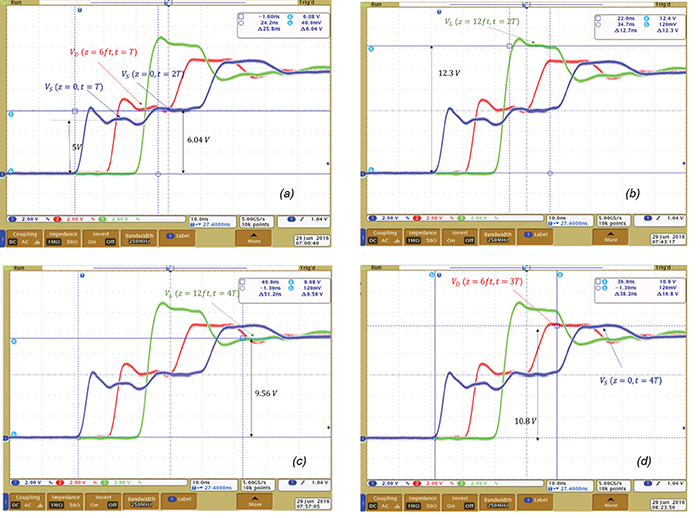
The transmitted voltage wave travels towards the load were it gets reflected with a load reflection coefficient equal to one (open load). The total voltage at the load is, therefore, at t = 2T is (shown in Figure 4(b)):
![]()
The reflected voltage at the load (6V) travels back towards the discontinuity where it gets reflected and transmitted. Let’s look at the reflected voltage first. The reflection coefficient (from the right) at the discontinuity is

The reflected voltage at the discontinuity is
![]()
This reflected voltage wave propagates towards the load where it gets reflected. The total voltage at the load, at t = 4T,
![]()
This is shown in Figure 4(c). The incident wave that arrived at the discontinuity (from the right) at t = 3T is also transmitted.
The voltage transmission coefficient for the wave incident from the right is

The transmitted voltage (from right to left) at z = 6ft is
![]()
Resulting in a total voltage at the discontinuity of
![]()
This is shown in Figure 4(d). Finally, the transmitted voltage of 4.8 V arrives at the source at t = 4T, resulting in the source voltage rising to (shown in Figure 4(d)).
![]()
This process continues until the steady state value (of 10 V at all locations) is reached.